We reached a point where the Belgian map has been completely framed out, which means that all the hexes are drawn and it is usable for play testing game modules. It still needs additional work to make it production ready, such as the village, town and city names, the names of rivers and hill numbers. We also have a series of things that need to be fixed on it, but they are all minor.
The map is 73×50 (3,650) hexes at 5,000 yards per hex, which covers parts of Holland, Luxembourg, France, Germany and most of Belgium. As we were pushing TOCS into an operational scale from the tactical, we deviated from the 1,200 meter MASL hex size to 5,000 yards. Moving to an operational scale meant that the game system had to deal with different unit sizes, like Divisions, Brigades and Regiments, and in some case Battalions. As the typical front for a WWI Division was 5,000yds, this became the chosen hex scale for the new map, roughly 3.81 times bigger than the MASL 1,200 meters size. While the MASL hex fits perfectly as a 3 board ASL scenario, the TOCS operational WWI module deviated from that, and doesn’t directly map to ASL scenarios. To accompany the map, we have a brand new set of TOCS WWI rules, which you can read about in the previous blog.
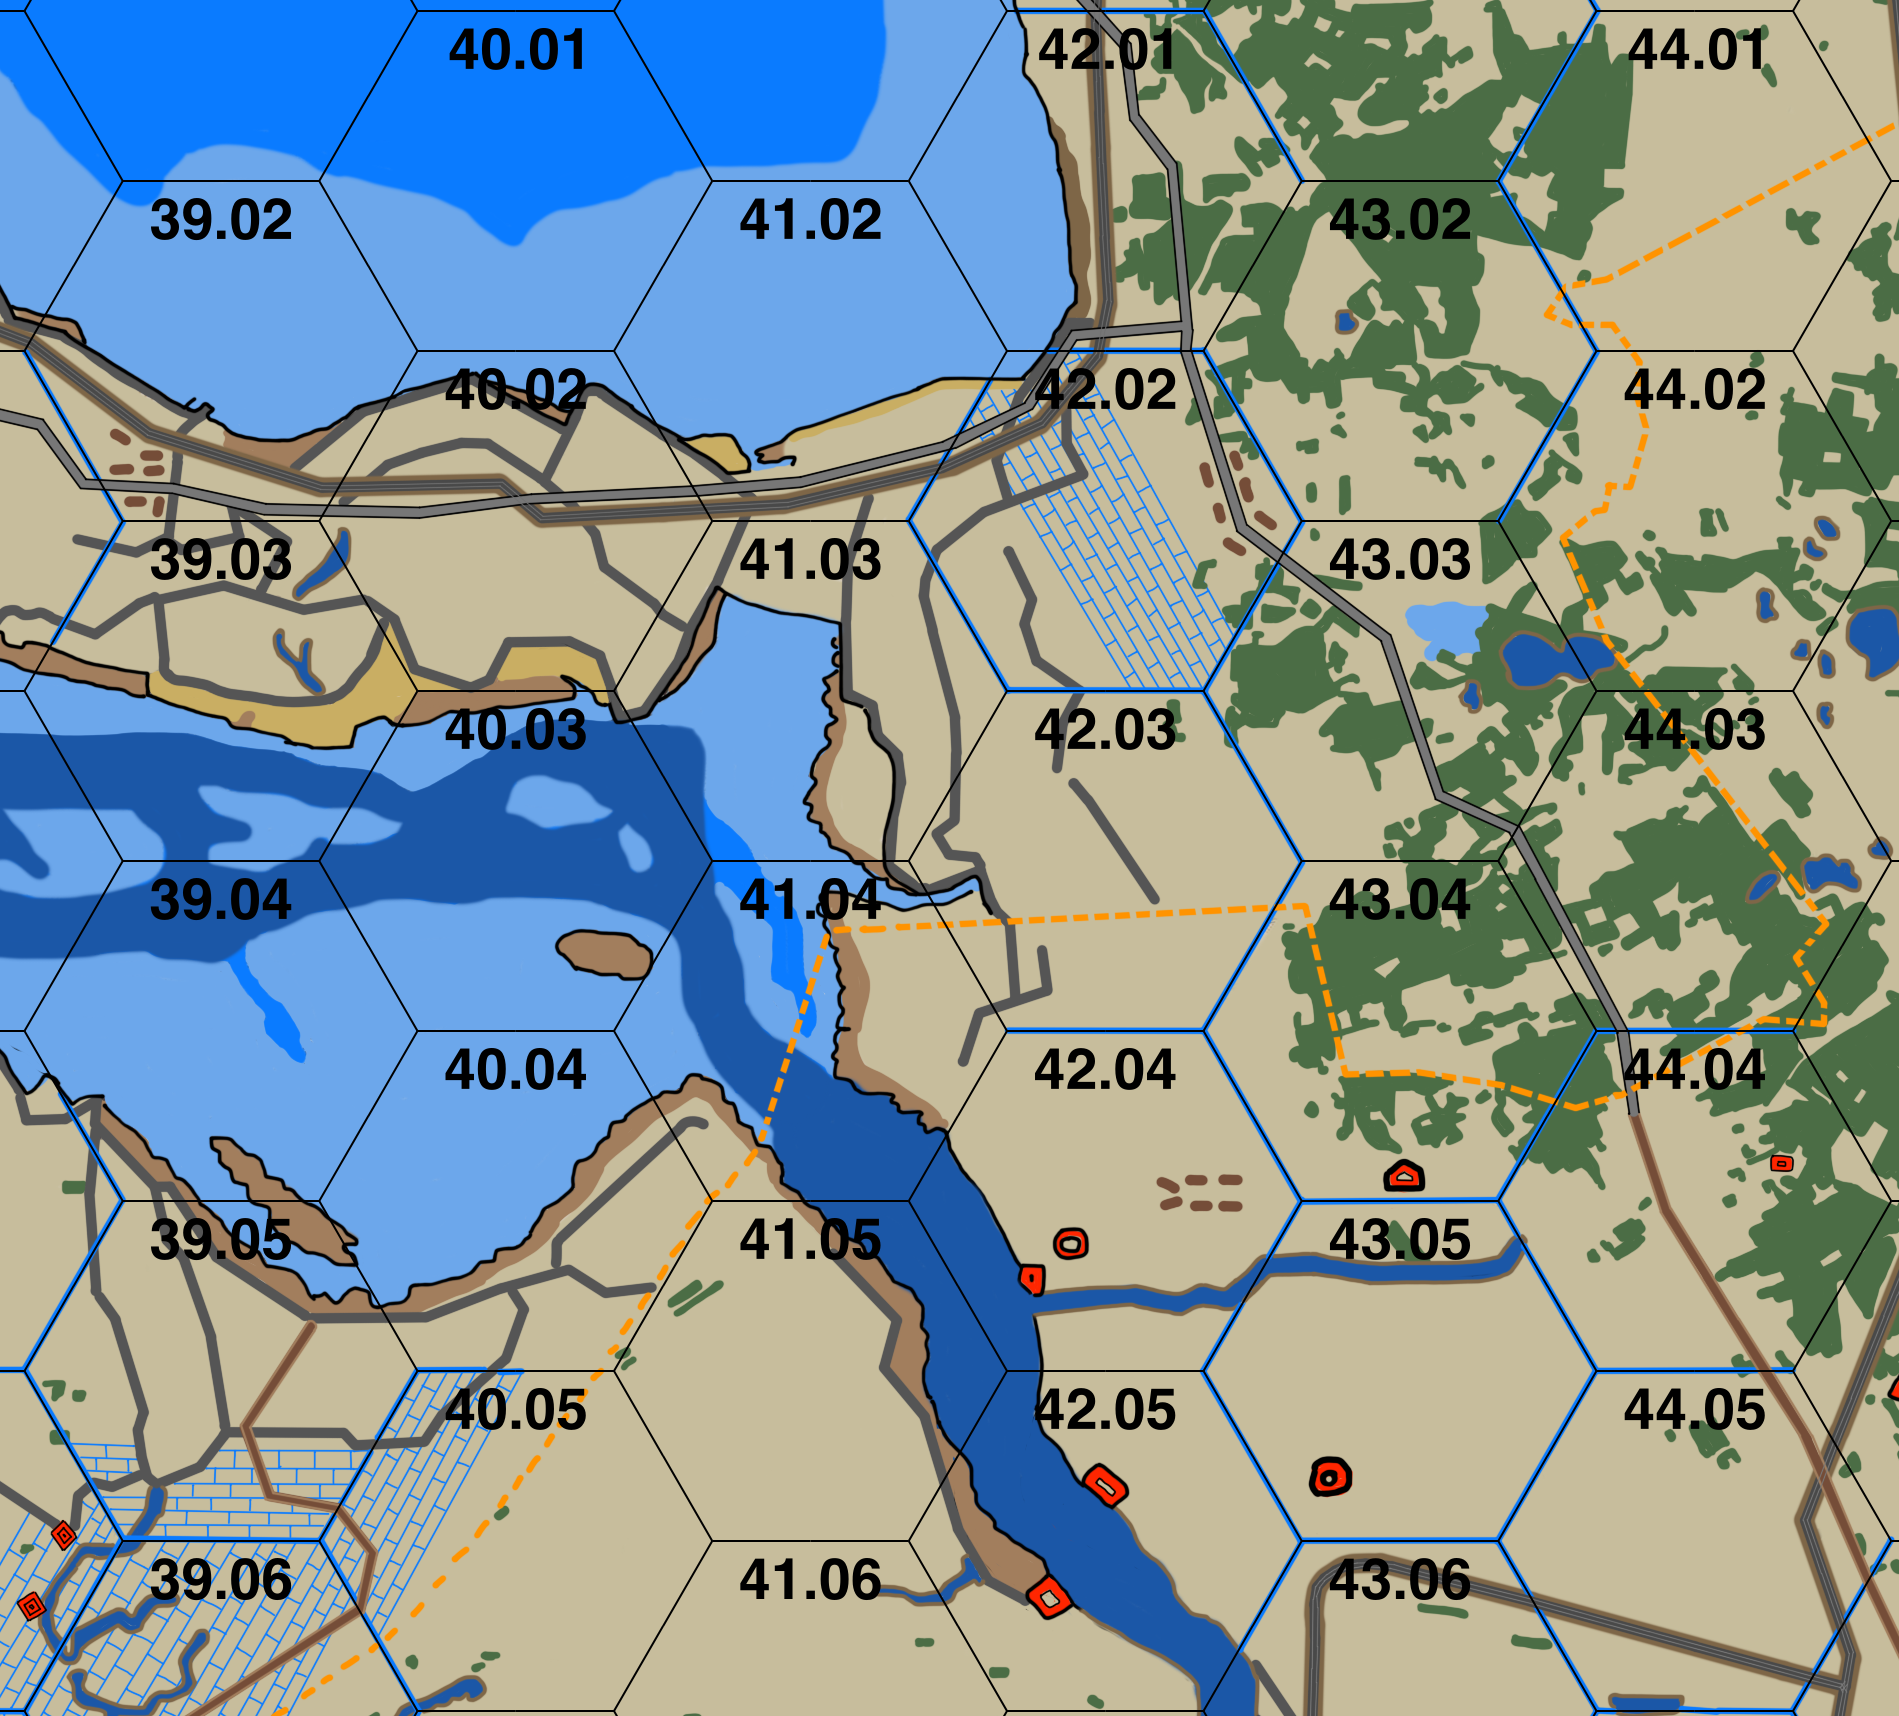
The image above shows the Scheldt Estuary that leads to the Port of Antwerp and some of the outlying fortifications around the port city. As can be seen we also deviated from some of the three panel hex terrain features. We did this because we now have a rich set of metadata descriptions that describe each hex so that software can act on them programmatically. Now that all aspects of the hexes can be defined by metadata we can automate most aspects of game play on the board, such as observation ranges, movement costs and much more. Players will not have to deal with figuring out what the movement costs are, this will all happen by the TOCS system. All players need to do is select a unit and put it in Move mode and the TOCS system will show the hexes that it can legally enter. And for those familiar with the VASSAL software system, a player will be able to drag-and-drop the unit around the map. While we can go into great detail regarding the proposed User eXperience (UX) features we have in mind, this blog post will focus on the map and the changes that TOCS is making to support different time periods and scales.
One interesting aspect of working on an operational scale map, is that it could be drawn in layers using Pixelmator, just like the other maps, but there are special 1870, WWI and WWII layers built in so that the correct ones can be enabled to create a unique map for each time period. By simply toggling the time period layer(s) and exporting the map as a PDF we can generate an 1870 Belgian map, WWI Belgian map and a WWII Belgian map all from the same drawing. This will allow TOCS Game Module developers to create new product offerings based on any of these time periods, such as the Franco Prussian War, WWI and WWII 1940 and 1944. Likewise, we intend to push the TOCS game system into these same time periods. For example the TOCS WWI Rules actually cover 1870 to 1935, where the TOCS WWII rules pick up from 1936 to 1955. While the map can be used for WWII the scale it is still 5,000 yds and MASL is not supported.
As a first foray into changing scale and time period, it was very successful. Very little had to change to support this. The most challenging aspect that we are still working on are the National Characteristics that describe the characteristics of all countries world-wide. Pretty daunting, so don’t expect this overnight by any means.
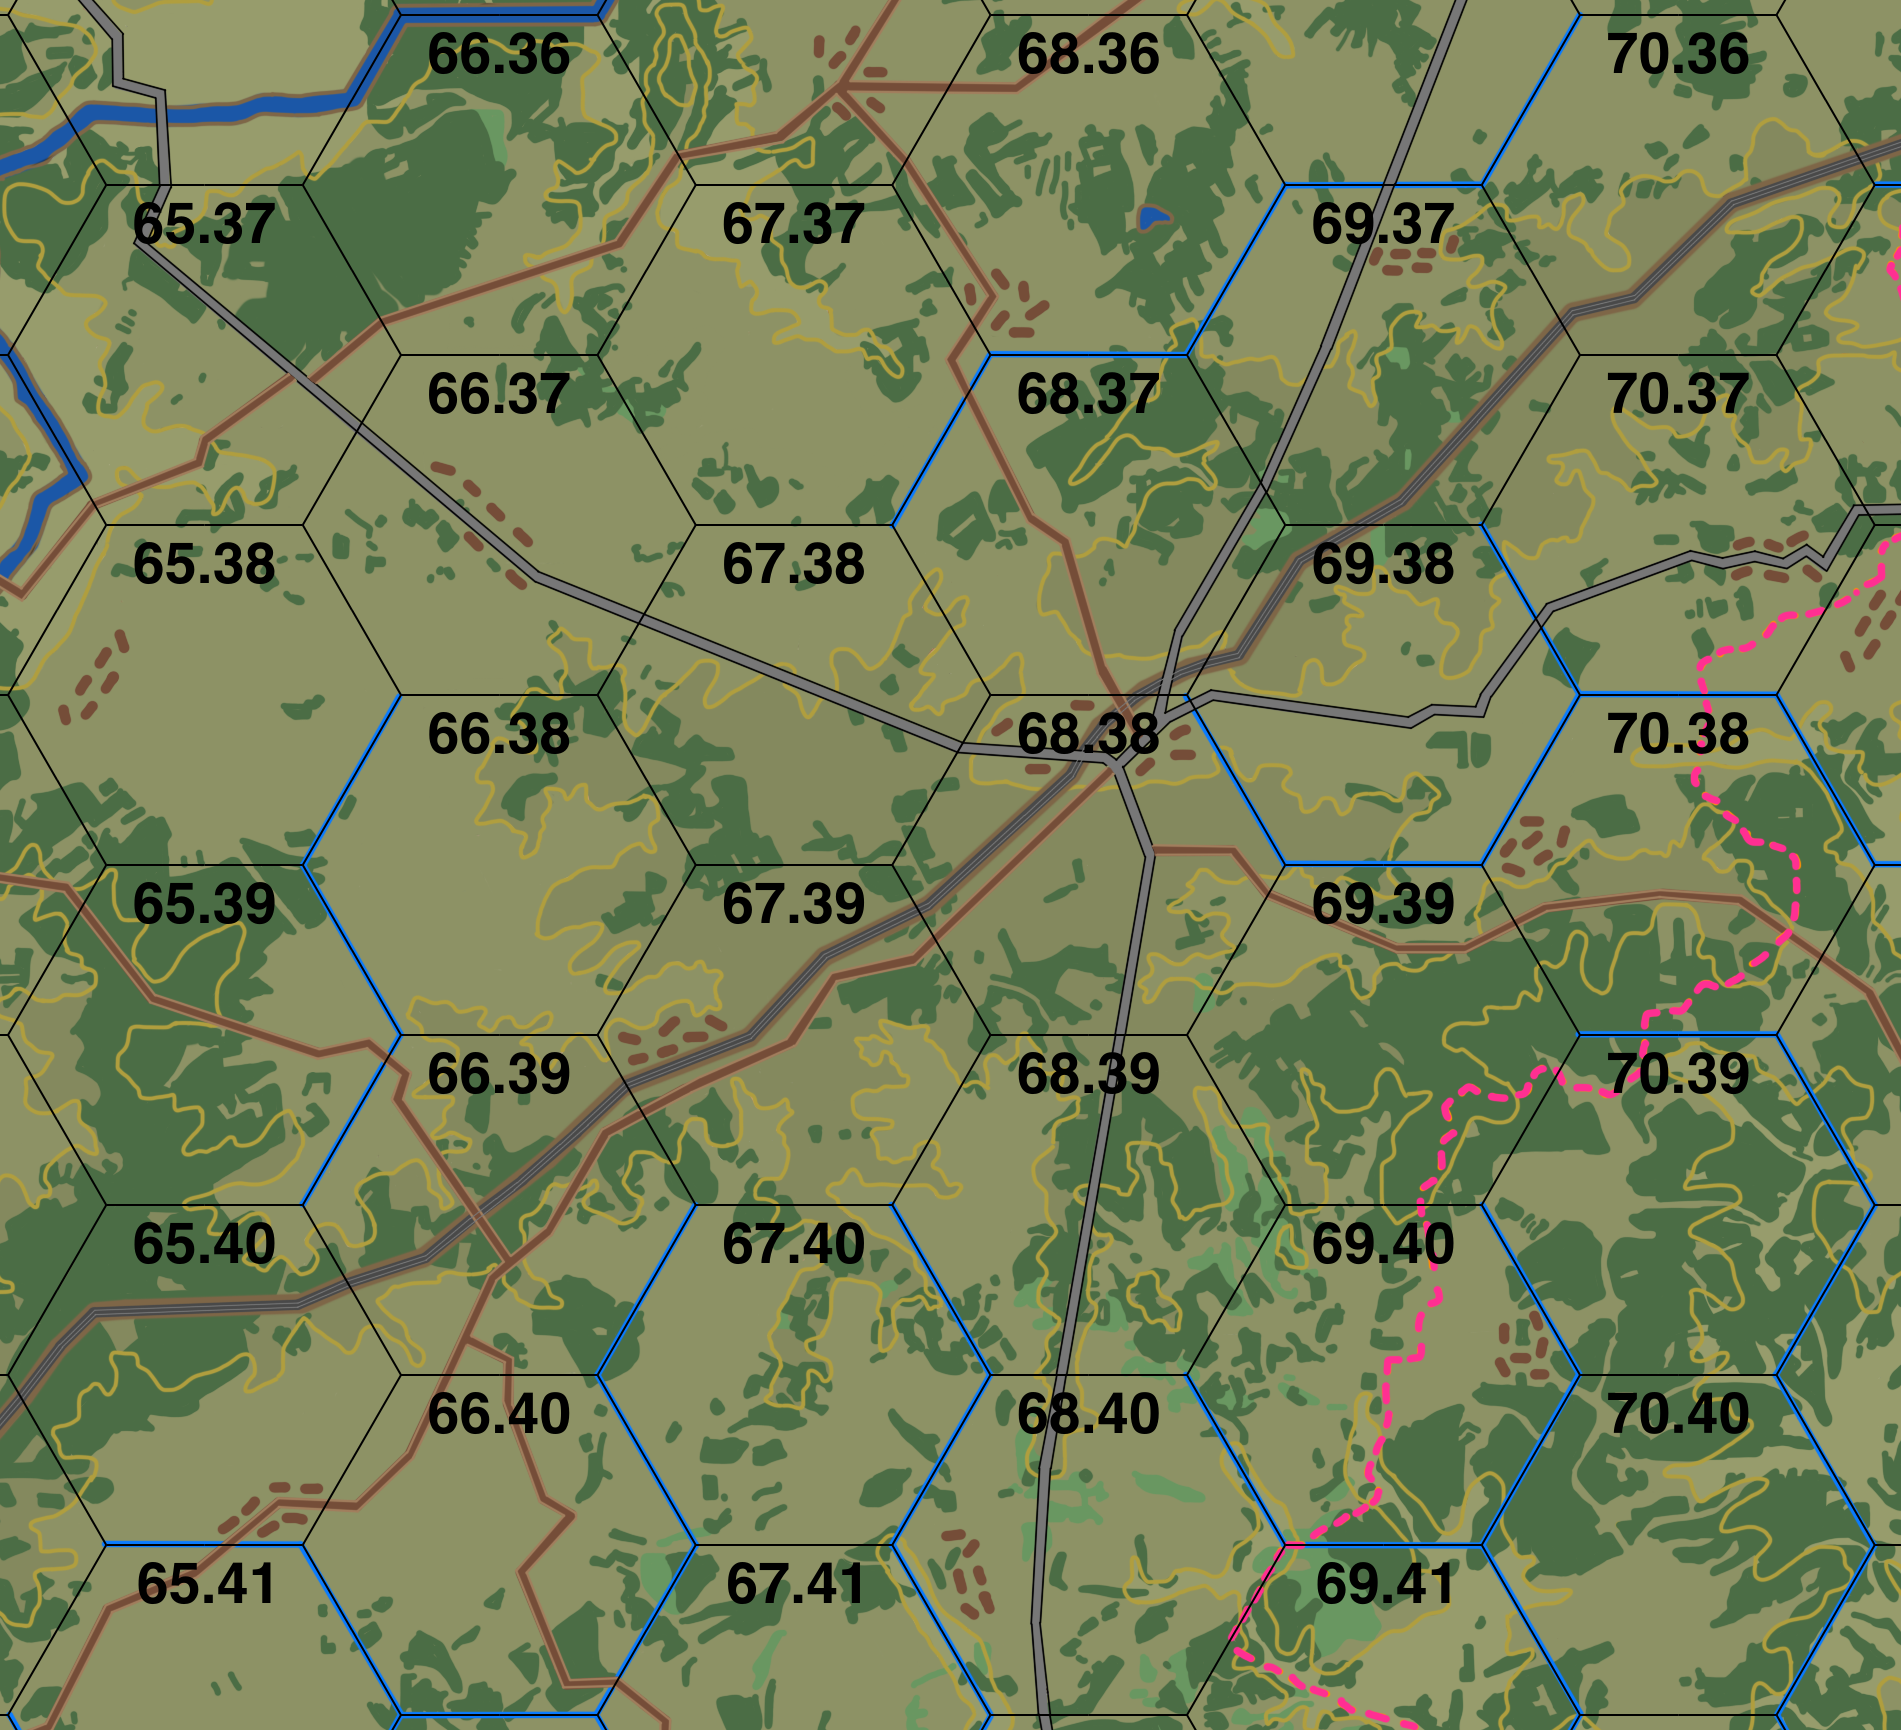
The image above illustrates the town of Bastogne in the Ardennes Forrest. A quick look reveals a few interesting aspects of the area, such that it is not as forested as one would have thought. When drawing this map I specifically kept the woods and forests as accurate as possible as well as the 100m elevation changes. Now that the maps will be data-driven based on the metadata, the designer has more freedom to make the map look real as compared to forcing a rigid set of terrain policies. The trick will be to pick the metadata attributes that best suite the map rendering. What you get are maps that look more realistic. Another aspect of the map is that you could use it for navigation by car, but I’d advise against it. The railroads and roads are as true to their path as possible. So of you fire up your favorite Geo Map tool and look at the Earth and compare it to this map, you will be surprised on how accurate it is. That’s not to say that the map doesn’t have abstractions and things needed to nudged to fit in a hex, but in general the map remains true to the topography.
So what’s next? We probably won’t be back to this map until we start working on a Game Module that will utilize it, in the meantime we have a whole bunch of game client and server-side services we are working on. Once again, thanks for following us at Brick Mill Games, and stay tuned for some exciting things in the near future, as we continue to develop the next generation of games.
0 Comments